As we near the end of the weekend an area of high pressure will be developing across the southeastern United States and this will prompt a warm front to lift northward towards southern New England. Models indicate that the warm front will push through likely during the day on Tuesday. As the warm front inches closer to the region we will see a slow moderation of the temperatures and once the warm front passes temperatures will really escalate upwards.
At the same time a warm front will be lifting northward, out across the western United States a trough will be developing as a potent piece of shortwave energy digs into the desert southwest. As this piece of energy continue to strengthen and sharpen the developing trough, the response to this will be to build a ridge into the eastern United States and slowly expand northward. As this process occurs this will turn the wind direction from a more northerly direction (which we are seeing now) to a more south/southwesterly wind direction. This will allow for a unseasonably warm low-level airmass to work well northward into southern New England by mid/late week.
Now that we have looked at the overall synoptic setup which is forecasted by several medium/long range forecast models we will now take a look at a few global teleconnections and then apply them to the synoptic pattern.
First off, we will take a look at the North Atlantic Oscillation (NAO). During the winter months, the state of the NAO is one of the main players in determining how our weather will be. The NAO is broken down into three different phases; positive, neutral, and negative. The NAO is deemed positive when the Icelandic Low Pressure center is deeper than average and the Azores High Pressure center is also stronger than average. This increased pressure gradient allows for a stronger jet stream across North America. With the jet stream being stronger it's more difficult to generate deep troughs, therefore, the jet stream remains rather flat and further to the north, keeping the cold air bottled up in the Arctic or the other side of the globe and allowing for milder air to invade the United States. The NAO is deemed negative when both the Icelandic Low Pressure and Azores High Pressure centers are weaker than average. This leads to a decreased pressure gradient which weakens the jet stream allowing for greather potential of troughs to form which allow for colder air to be delivered into the United States. The NAO is considered neutral when there is no clear signal or the the phase is too weak to have a major influence on the overall weather pattern. Currently the NAO is slightly positive but the signal is weak so it's more in the neutral zone. This is expected to change as we move through this weekend and into next week as model ensemble consensus is for the NAO to continue heading into the positive territory and even become quite positive:

Secondly, we will take a look at the Arctic Oscillation (AO). The AO sort of works in conjunction with the NAO and both are closely related. Like the NAO, the AO is measured in three different phases; positive, negative, and neutral. The AO is considered to be negative when geopotential heights over the Arctic region are well below-average leading to a much stronger than normal Polar vortex. This leads to a stronger jet stream which inhibits colder Arctic Air from being transported further south into the United States. during the negative phase of the AO, the geopotential heights are higher than average across the Arctic region. This leads to a weaker than average Polar vortex which leads to a weaker jet stream allowing for colder air to be transported further south into the United States. When the signal is not clear or weak, the AO is considered neutral. Currently, the AO is more neutral, however, model ensembles forecasts are for the AO to quickly rise into positive territory and become quite positive, at least for a brief time:

Thirdly, we will take a look at the Pacific North American pattern (PNA). The PNA can actually play a significant role on the weather pattern across the United States, especially when the PNA signal is strong or when the NAO/AO signal is fairly weak. The PNA is also measured as either being positive, negative, or neutral. A positive PNA consists of above-average geopotential heights over the western United States (or a ridge) and below-average heights across the southeastern United States (or a trough). This leads to above-average temperatures across the western United States with below-average temperatures across the southeastern and eastern United States. During the negative PNA phase there are below-average heights across the western United States (or a trough) and above-average heights across the eastern/southeastern United States. This leads to below-average temperatures across the western United States and above-average temperatures across the eastern/southeastern United States. Currently, the PNA is quite positive, although computer ensemble forecasts indicate that the PNA will be quickly descending towards the negative phase by next week:

Finally, we will take a look at the progression of the Madden-Julian Oscillation (MJO) waves. The MJO is a fluctuation of atmospheric pressures across the equatorial Indian Ocean and western Pacific ocean. These MJO waves will traverse across the Pacific Ocean varying in different strengths and one major influence on the strength is the temperatures of the water they cross over. MJO waves traverse along the equator in either a cyclonic or anticyclonic circulation. During the cyclonic phase moisture is added to the MJO wave, enhancing convection/rainfall associated with the wave and during the anticyclonic phase the MJO wave suppress convection/rainfall associated with this wave. MJO activity can play major roles in regions affected by the monsoon in both India and in the southwestern United States. MJO waves can also greatly influence the weather pattern across the United States and temperatures. The journey of the MJO is broken down into 8 different phases with each phase depending on the location of the MJO. Between now and the 17th of January GFS ensemble forecasts have the MJO not only entering phases 4-6 but the potential for the MJO wave to be rather strong. In reading the diagram below, the closer the "lines" to the center of the graph, the weaker the MJO wave and less of an influence on the weather pattern. The further towards the borders of the chart, the stronger the wave. Below is the diagram:
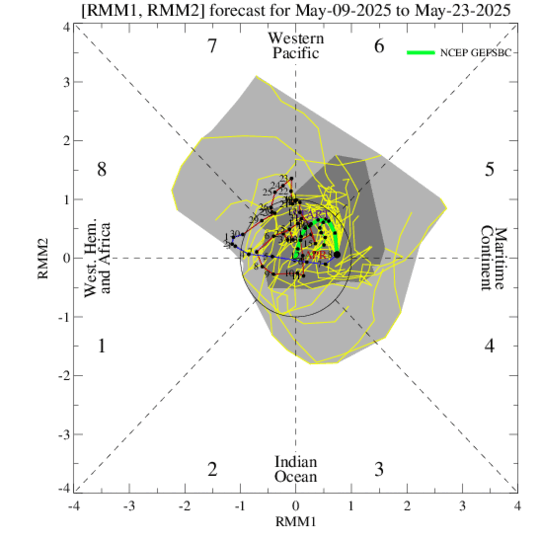
Phases 4-6 of the MJO are typically associated with temperatures above-average across much of the central/eastern United States and with below-average temperatures across the western United States.
Now we place all of this together. When looking at the forecasted synoptic pattern by several medium-long range computer forecast models and looking at the projected trend in several key global teleconnections we can conclude that the upcoming period looks to not only be above-average across much of the eastern United States but the potential will exist for at least a few days with temperatures running well above-average. The height of the warmth may occur in the Thursday-Sunday timeframe before a strong Arctic front looks to slide eastward. It's possible we may be looking at record high temperatures for portions of the eastern United States and some locations could see temperatures running anywhere from +10F above-average to +2-F above-average.
Following this period, it does appear we will see a transition towards more average or even below-average temperatures but other than that the signals are not very clear as to how exactly the pattern will evolve.
No comments:
Post a Comment